Learn how MyEnlighten displays your energy consumption when you have consumption monitoring installed with your system
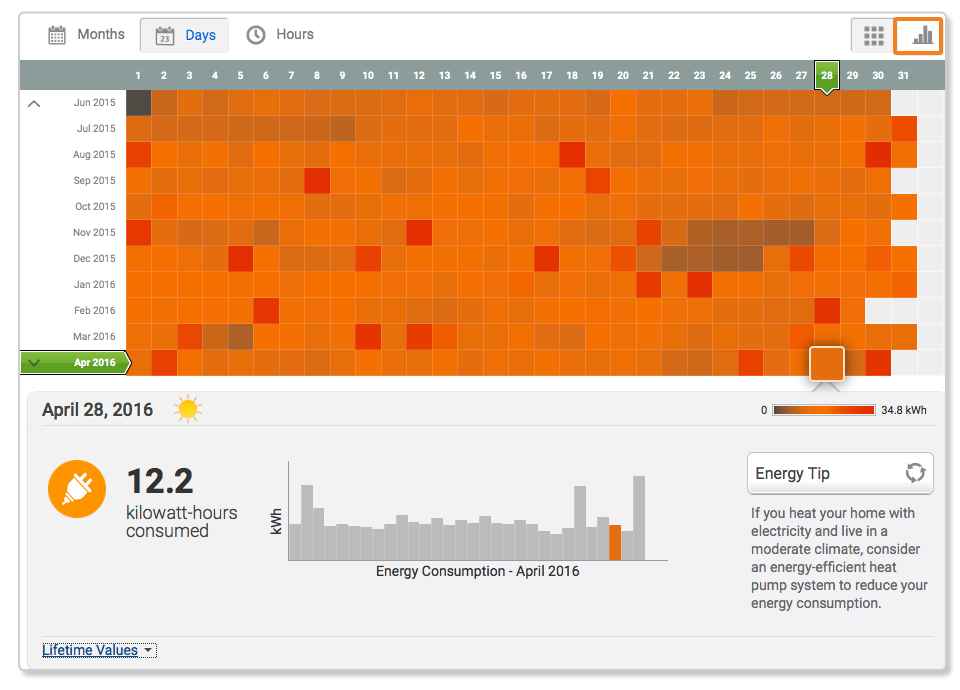
The MyEnlighten consumption screen provides an at-a-glance view of your home’s energy consumption as a grid of square tiles (or graph), each representing a block of time. There are three views of the grid:
- In the Months view, each row is a year and each tile is a month.
- In the Days view, each row is a month and each tile is a day.
- In the Hours view, each row is a day and each tile is 15-minutes.
The Days view displays by default.
The energy consumption grid shows what your home has consumed in watt-hours (Wh), ranging from grey for low consumption to red for high consumption.
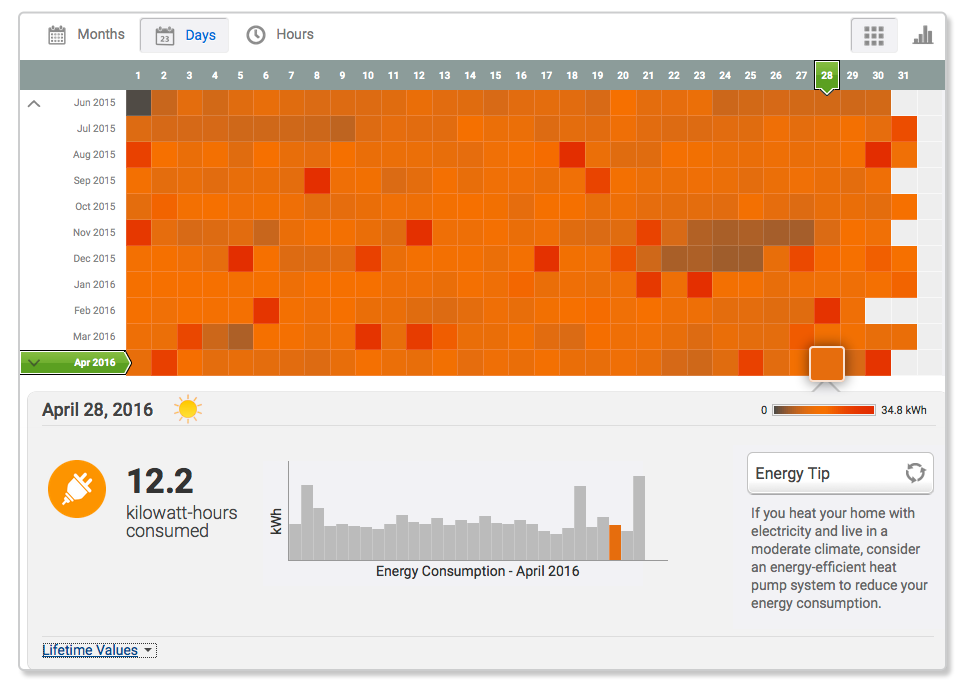
The grid initially highlights today. Look below the grid to see consumption details:
- Today’s energy consumption in kilowatt-hours (kWh).
- Today’s consumption graphed within the context of weekly consumption.
- Energy Tips. Click the
 icon to cycle through different tips.
How do I use it?
As you hover over different tiles in the grid, the details below change to display energy consumption values for the date outlined in white.
You can use this to explore energy consumption patterns; shades of grey represent periods of low consumption, while shades of orange represent more typical periods of consumption for your home. A red tile indicates a period of unusually high energy consumption. With theHours view, you can explore patterns for a single day. With the Months view, you can explore patterns over the course of the year.
You can examine consumption for a selected timeframe by clicking a tile. This “locks” the grid for the selected timeframe. On the Days and Hours views, a weather icon displays next to the date. Click the icon to see historical weather for that day.
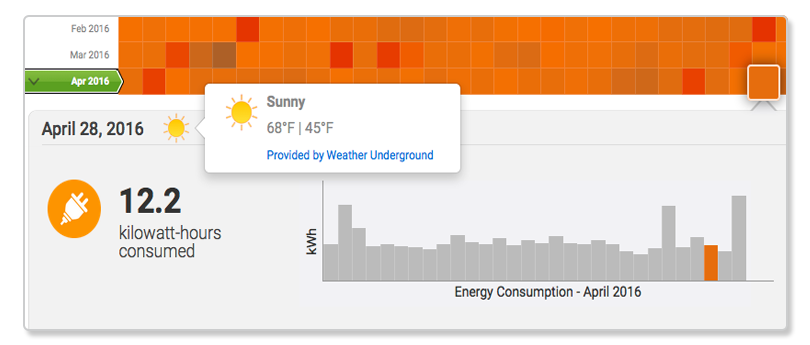
When the grid is locked, you can use the arrow keys on your keyboard to move up and down, or left and right. Click the selected tile to “unlock” the grid.
Does MyEnlighten have a graph of my energy consumption?
If you prefer to see consumption as a graph, click the graph icon at the top right of the Energy Consumption panel.